
The Version Analytics Dashboard is one of the most valuable areas of PageTiger for anyone who needs detailed reporting on a specific version. It brings visit, visitor and page-level analytics together in one place, and every data set can be exported to CSV or XLSX for further reporting.
-
A single view of performance
Visits, visitors and page-level engagement are available from one dashboard. -
Exportable data
Any data shown in the dashboard can be downloaded as CSV or XLSX, making it easy to build reports. -
Early warning signs
Page-by-page visit data helps identify exactly where readers lose interest, so content can be improved before the next version goes out. -
Reader-level detail
Where identity is captured, see who has engaged with a version and cross-reference against an Expected Visitor List.
How to navigate to the Version Analytics Dashboard
-
Navigate to a document.
-
Select 'Manage Version' for the version you want to analyse and view reporting for.
-
Select ‘Analytics’ from the list of options available.
Use the filter in the top right of the page to narrow results - for example, to a specific user, or to published visits only, which excludes any testing data.
What's on the dashboard
Visits
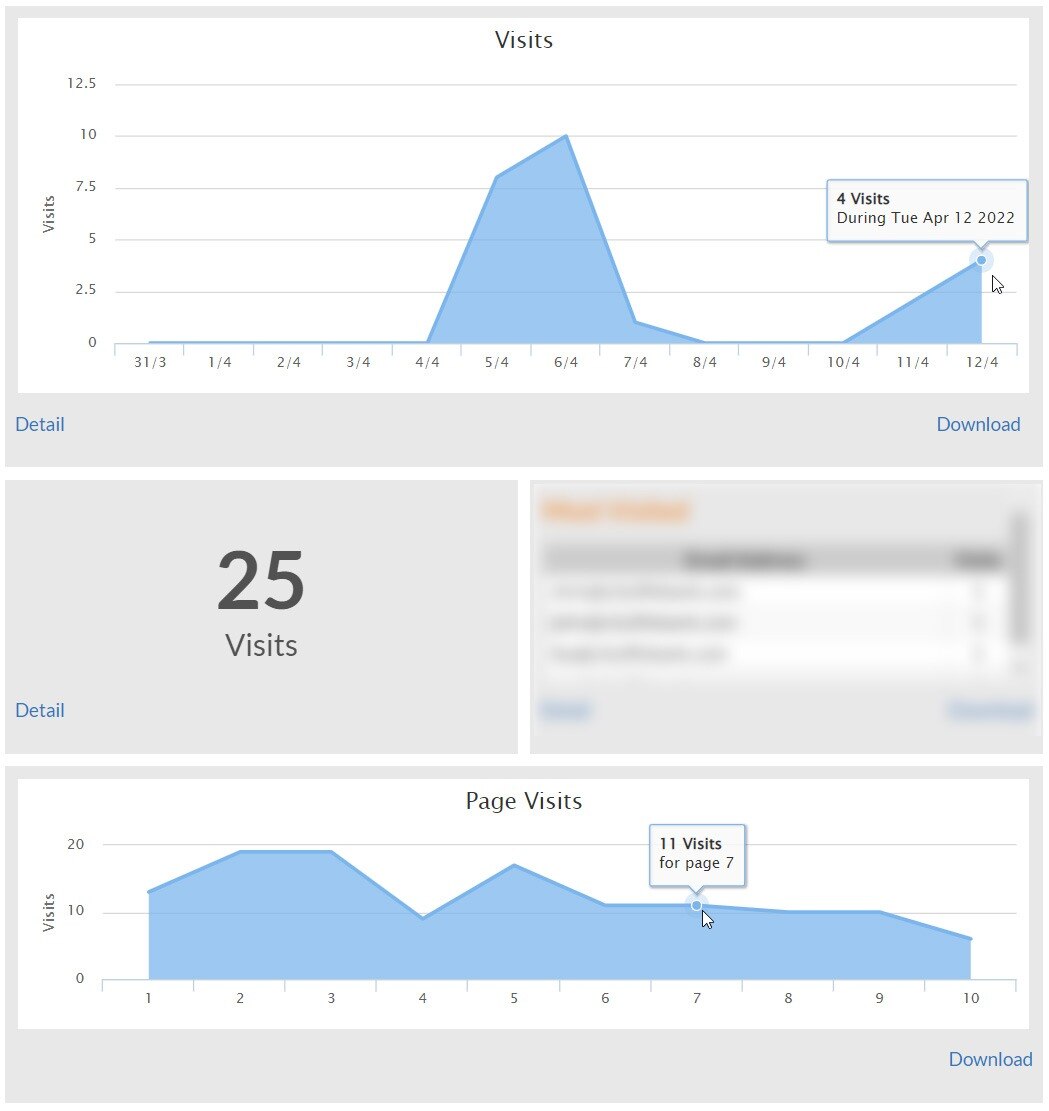
Three panels relate to visits:
-
Line graph
The number of visits by date, at the top of the page. -
Visits thumbnail
The total number of visits, in the centre of the page. -
Page Visits graph
The number of visits each page in the version has had.
Page Visits are a useful way to gauge how well a version is performing. For example, a sharp drop in views after page 10 could suggest readers are losing interest around that point.
Visitors
Three panels relate to visitors:
-
Recent visitors
Email addresses of the most recent people to visit the version. -
Most frequent visitors
Email addresses of the readers who've visited the version the most. -
Expected Visitor List
Where an Expected Visitor List has been created, this shows the percentage of that list who have viewed the version (for example, 5% of the Marketing Team list).
These panels display data if the document is set up to capture the visitor identity - for example, via a reader login or SSO security rule.
Page/Module table
This table allows for a deeper look at engagement, showing the number of views each page has had, along with data for any interactive elements on it.
-
Select the small black arrow next to a page number to view the list of interactivity on that page.
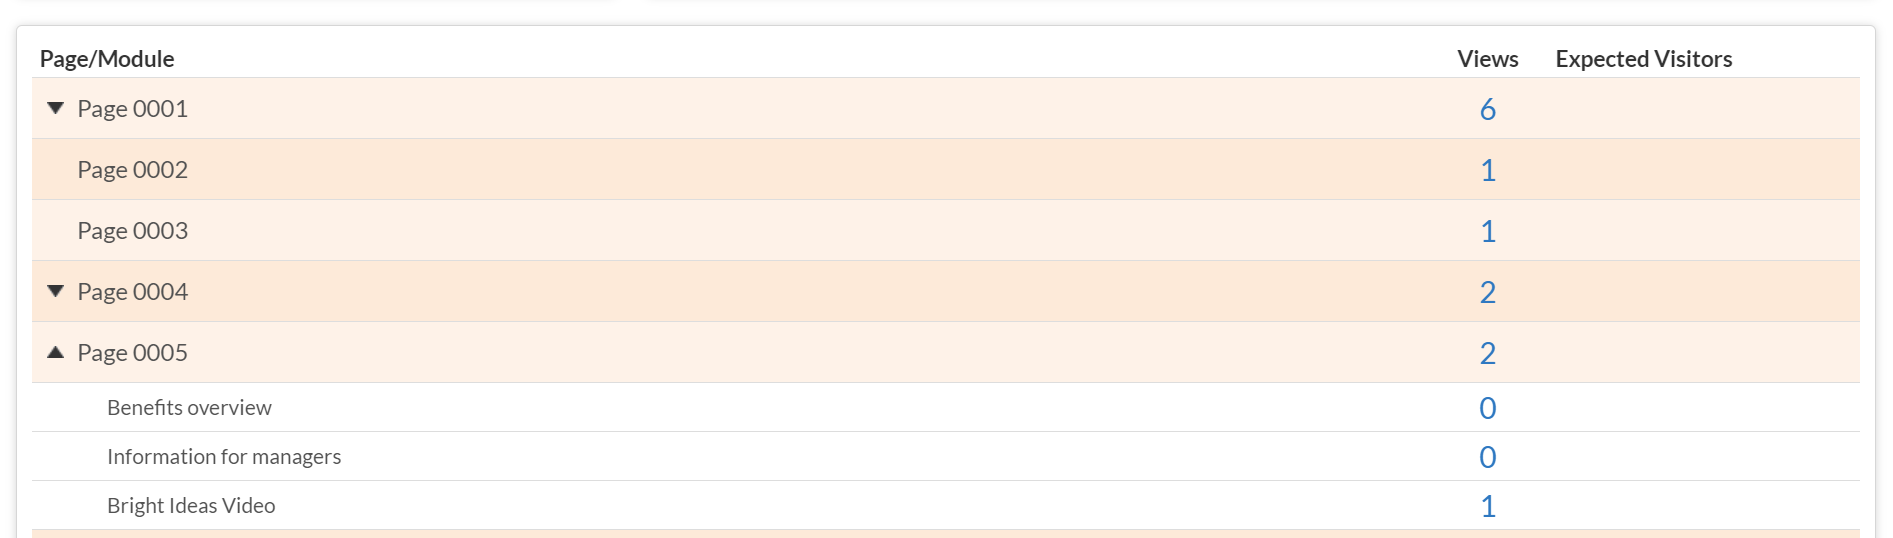
The number in the 'Views' column shows how many times a page or interactive element has been viewed, regardless of whether the same reader viewed it more than once.
Select the number in the 'Views' column to see a full breakdown, including reader email address (where captured) and the date and time of each visit.